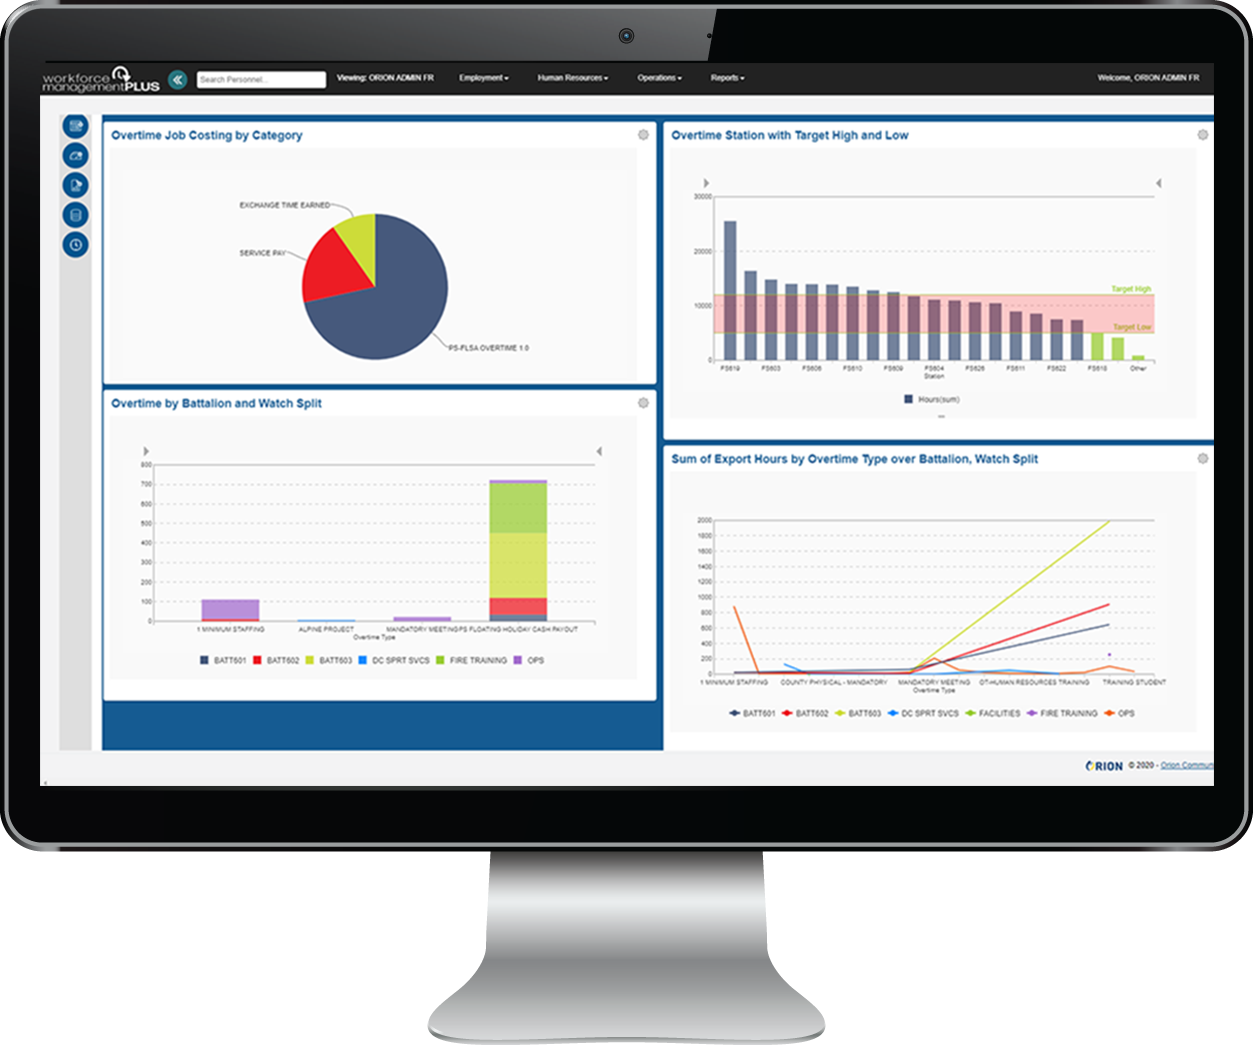
We get it. You’ve got a lot on your plate and don’t have time to set up your analytics. No problem—that’s right up our alley! Just let us know what areas you’d like to have analyzed, and our analytics team will have you viewing, sharing, and selecting data visualizations in no time.

Not sure what to analyze? We can help.
Our consultants will provide you with best practices ideas about the categories you may want to consider. Since we do this for public safety agencies all the time, we've probably got a few ideas you haven't yet considered!
Displaying your chosen data in a concise, visually appealing way is a crucial step. But even the best visualizations, charts, and dashboards are of limited use if you can’t present and share them effectively—so let us act as your analytics setup guru! With our help, you’ll be able to quickly interact with your data and share your analytics on a scheduled basis.

This initial course focuses on setting up your data models to logically create data groups. Our follow-up course then covers how to interact with your data to create charts, tables, and other visualizations like galleries and dashboards. Once we show you how to share your analytics and schedule reports for automatic distribution, you’re off to the races.
Sales Inquiries: 866.225.1394
Customer Support: 866.603.1599
F: 312.258.1753
Sales Email: sales@fieldware.com
Customer Support Email: support@fieldware.com
© 2026 FieldWare LLC. All Rights Reserved. FieldWare® is a registered trademark of FieldWare LLC. | Privacy Policy